What is Microsoft Power BI?
Microsoft Power BI is a platform that consists of a suite of services, applications, and connectors that combines many data sources into visuals to offer business insights. Irrespective of your data sources, such as an Excel spreadsheet or a hybrid data warehouse, Power BI establishes a connection to your data, views the data, identifies the essential details, and shares them with anyone you specify. This cloud-based business intelligence platform shares data insights to offer business capabilities and interactive visualizations. It helps users to build customized reports and dashboards quickly. Power BI can be used either as a standalone tool or in conjunction with other Microsoft products and services such as Excel, SharePoint, and SQL Server. Primarily there are three versions of Power BI as of September 2022: Free, Pro, and PPU (Premium Per User). The other license type is a Premium capacity-based license. Depending on the functionality needed, you may opt for a specific license. This post will look at some of Power BI’s best features and discuss why it’s so well-liked for business analytics. We will also comprehend how Power BI reports and dashboards differ.
Key Features of Power BI
Data visualization, data modeling, data exploration, and data mashupInteractive reportingReal-time dashboardsPredictive analytics.Integration with SQL databases, Azure cloud, and web platforms such as Facebook, Google Analytics, and Salesforce objects.Streamlined publication and distributionAbility to customize security featuresCortana integration for voice-based interactionArtificial Intelligence
How Power BI is Important as a Business Analytics Tool?
Analyzing data to learn more about how businesses perform is known as business analytics. Because it enables users to connect to several data sources, convert and model the data, as well as create visuals to acquire insights, Microsoft Power BI is a crucial business analytics tool. One of the versatile tools used by SMBs to large corporations to gain data insights is Power BI. To generate dynamic visualizations with drill-down capabilities, it offers a 360-degree perspective of the data for an organization. It is significant as a business analytics tool since it assists firms in improving operational effectiveness, making better decisions, and learning more about customer behavior. Key performance indicators (KPIs) may be tracked and monitored, and predictive models can be built to predict future trends, all with the aid of Power BI. On top of all, Power BI can also be used to design unique reports and dashboards suited to a business’s particular requirements.
Differences Between the Report and the Dashboard in Power BI
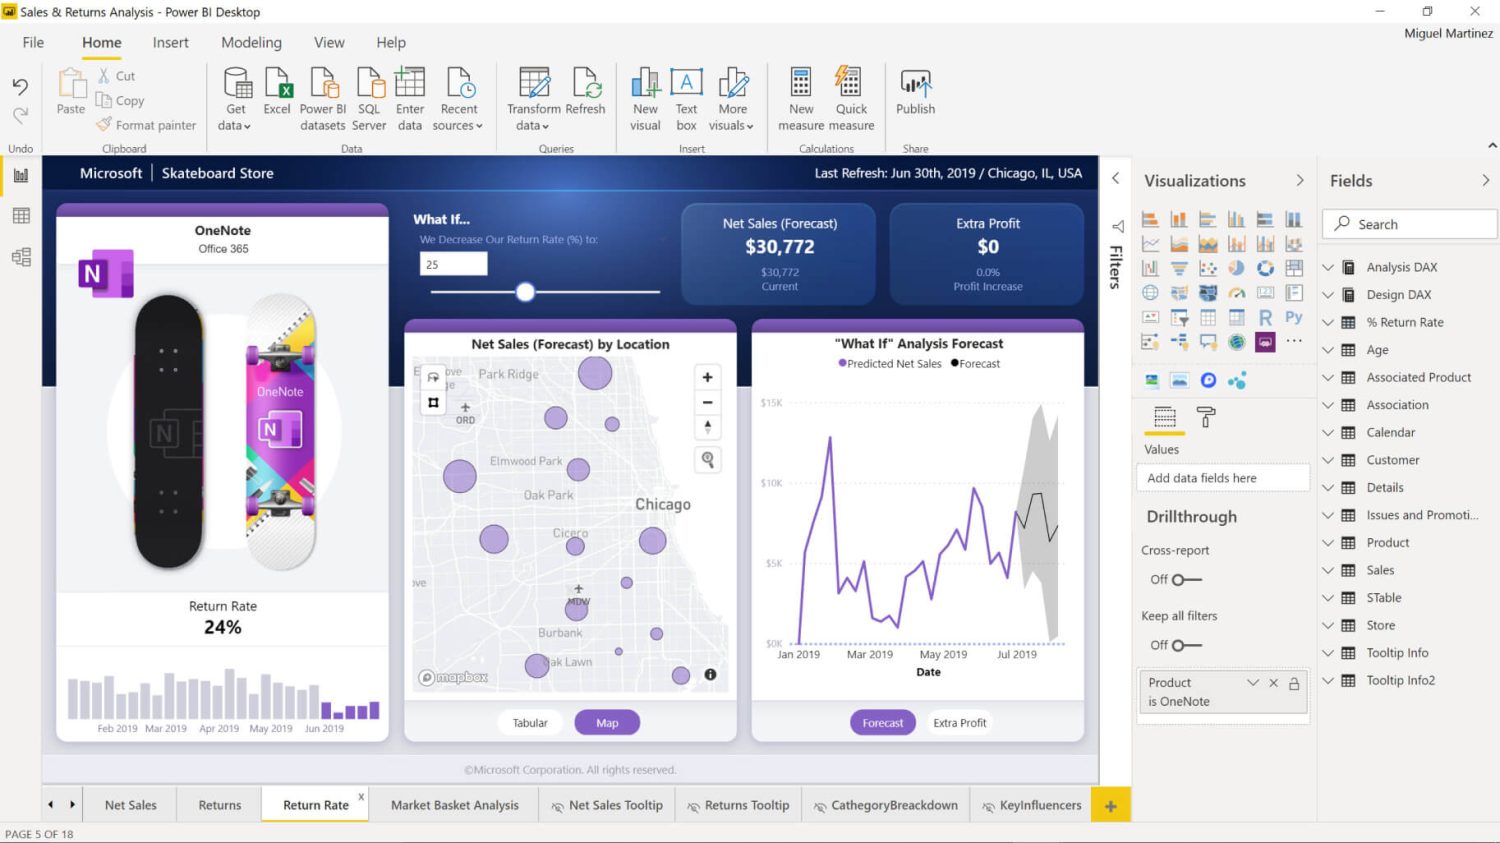
The Power BI dashboard and report are two significant components with distinct functions. Here are some distinctions between these two: Reports are supposed to provide extensive information about particular data sets, but a dashboard is a central portal created to give you an overview of your data. Reports help to dive down into the specifics of a given data set, whereas dashboards are often used to track key metrics and performance indicators. Data presentation: While a report consists of one or more pages with in-depth data in the form of text, images, charts, and data tables, a dashboard presents multiple visualizations in a condensed style so that the reader can get a view of the entire scenario. Customization: Dashboard representations cannot be customized except by switching between multiple graphics, while reports can be fully customized based on filters to get the desired results. The table below will examine some crucial distinctions between the Power BI dashboard and the report. To sum up, Power BI dashboards present crucial analytics and performance indicators in a single, centralized panel. It combines information from several reports and sources to produce a summary of business insight. It presents many data sets and cubes in a centralized dashboard with excellent visualization capabilities, assisting users in making decisions more rapidly. However, reports are standalone datasets, whereas power BI dashboards depend on them because reports have their properties and metrics to display, as well as drill-down and drill-up capabilities scattered across numerous pages.
Final Words
Microsoft Power BI is one of the most widely used platforms for commercial data analysis. Its usage depends entirely on the organization’s needs, and its dashboard and report are two separate components. Dashboards are sufficient if you only want a brief visual look at your data and want to conclude quickly. You may pull up multiple reports utilizing templates, filters, and slicers if you seek a deeper examination of the data. Next, you can check out how to get Microsoft Power BI Data Analyst Certification (PL-300).
![]()
![]()


![]()
![]()
![]()
![]()

![]()


![]()
![]()
![]()

